June 29, 2020
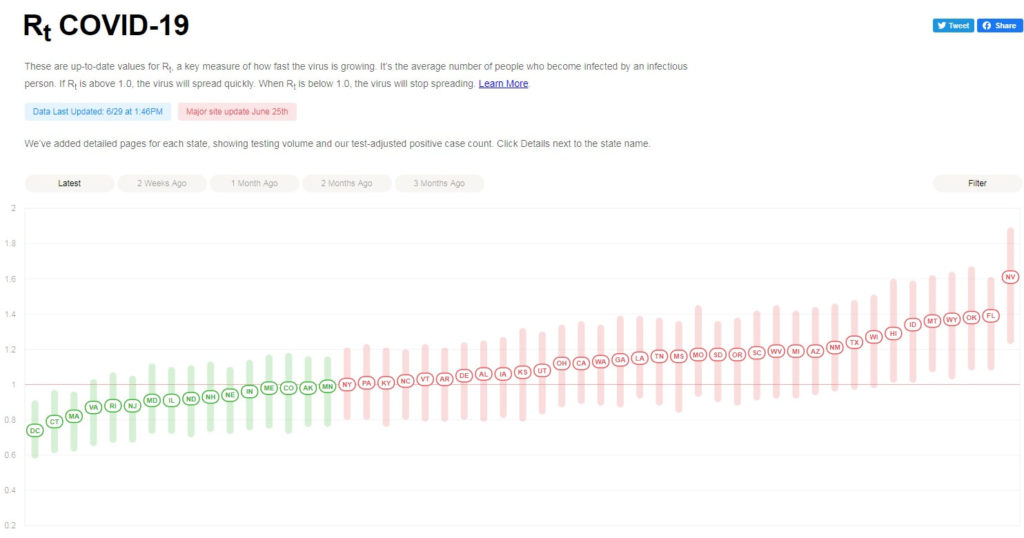
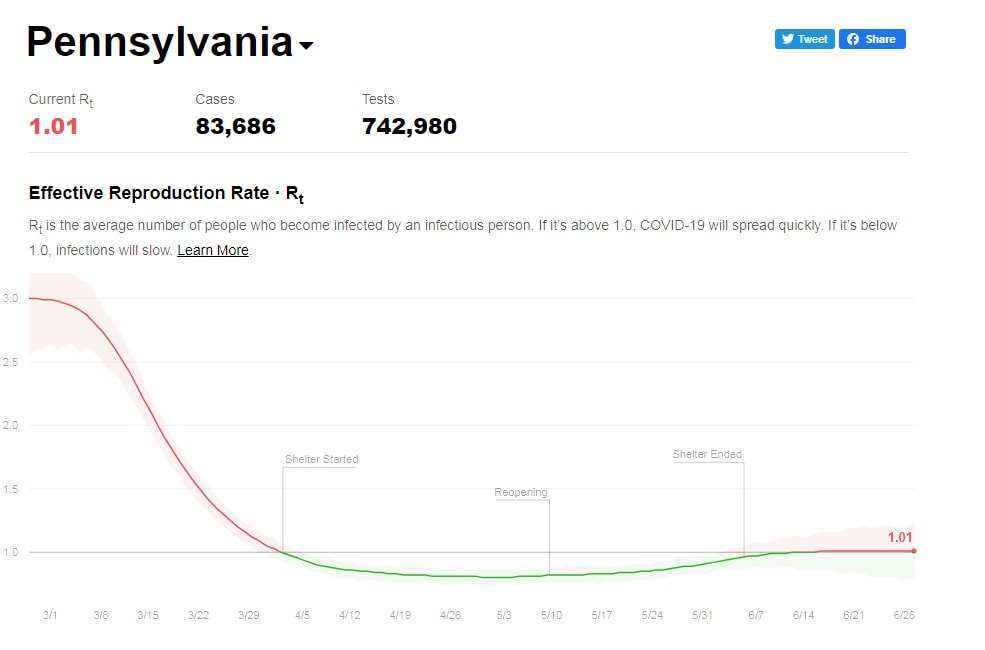
For those strategists interested in state-by-state COVID-19 data, this particular site provides visualizations of Rt data.
https://rt.live/
“Rt represents the effective reproduction rate of the virus calculated for each locale. It lets us estimate how many secondary infections are likely to occur from a single infection in a specific area. Values over 1.0 mean we should
expect more cases in that area, values under 1.0 mean we should expect fewer.”